
I've been thinking about treatment fidelity for a long time. As a clinician, a supervisor, and now as someone who gets to study it formally, the question I keep coming back to is: Why does adherence to teaching opportunities slip even when everyone involved is competent and committed?
The answer has practical implications for how we design programs, run supervision, and, as it turns out, build the tools we use every day.
The part of treatment fidelity that data collection systems don't usually capture
We talk a lot about procedural fidelity in ABA, but most of the tools built to support it only record what happened after the fact. A session note tells you what was run. Generally, it doesn't tell you what wasn't.
A learner who consistently misses certain targets may not be failing to acquire the skill, they may simply not be getting enough opportunities to practice it. That's treatment drift at the session level, and it's hard to catch when the data system only shows you what was collected.
True fidelity support requires an environment that makes expectations visible during the session, not just one that documents outcomes afterward. The system should reduce the cognitive load on the clinician, not add to it.
This is where the conversation shifts from measurement to design, and it's where behavioral science has something useful to say about the tools we use.
Setting trial counts that are worth adhering to
Before we can talk about improving adherence, we need to talk about what we're asking clinicians to adhere to. A trial count that doesn't reflect the learner's actual needs, instructional format, or session length is an arbitrary number. Adhering to it perfectly doesn't mean much, which is why trial counts are only one piece of true fidelity.
Trial count and instructional format work together. Discrete Trial Training naturally produces higher trial counts because of its structured, repetitive nature. Natural Environment Teaching embeds learning into play and routines, resulting in fewer discrete trials but often richer learning contexts. Setting the same expectations across both formats doesn't make clinical sense.
The Trial Count Framework I developed as part of our NIH-funded research outlines typical ranges and instructional formats for five learner profiles: Early Intensive Intervention, Intermediate, Advanced, Highly Symptomatic Older Child/Early Adolescent, and Older Adolescent/Early Adult. It's not a prescription, but serves as a starting point for calibrating expectations to the learner.
A few principles that hold across profiles:
- A high trial count means nothing if the learner isn't engaged or if data quality suffers.
- Very low trial counts may not generate enough learning opportunities for some targets.
- Trial count is a starting point for discussion, not a rigid prescription. Clinical judgment, learner response, and family priorities should always guide final programming decisions.
Download the full Trial Count Framework in the research whitepaper →
How to use session data to have better supervision conversations
Most BCBAs® I know spend their supervision time reacting. Something comes up in a session note, or a parent raises a concern, or a graph plateaus and nobody's sure why. The data you need to assess procedural integrity are there, but often times they're difficult to read quickly enough to act on proactively.
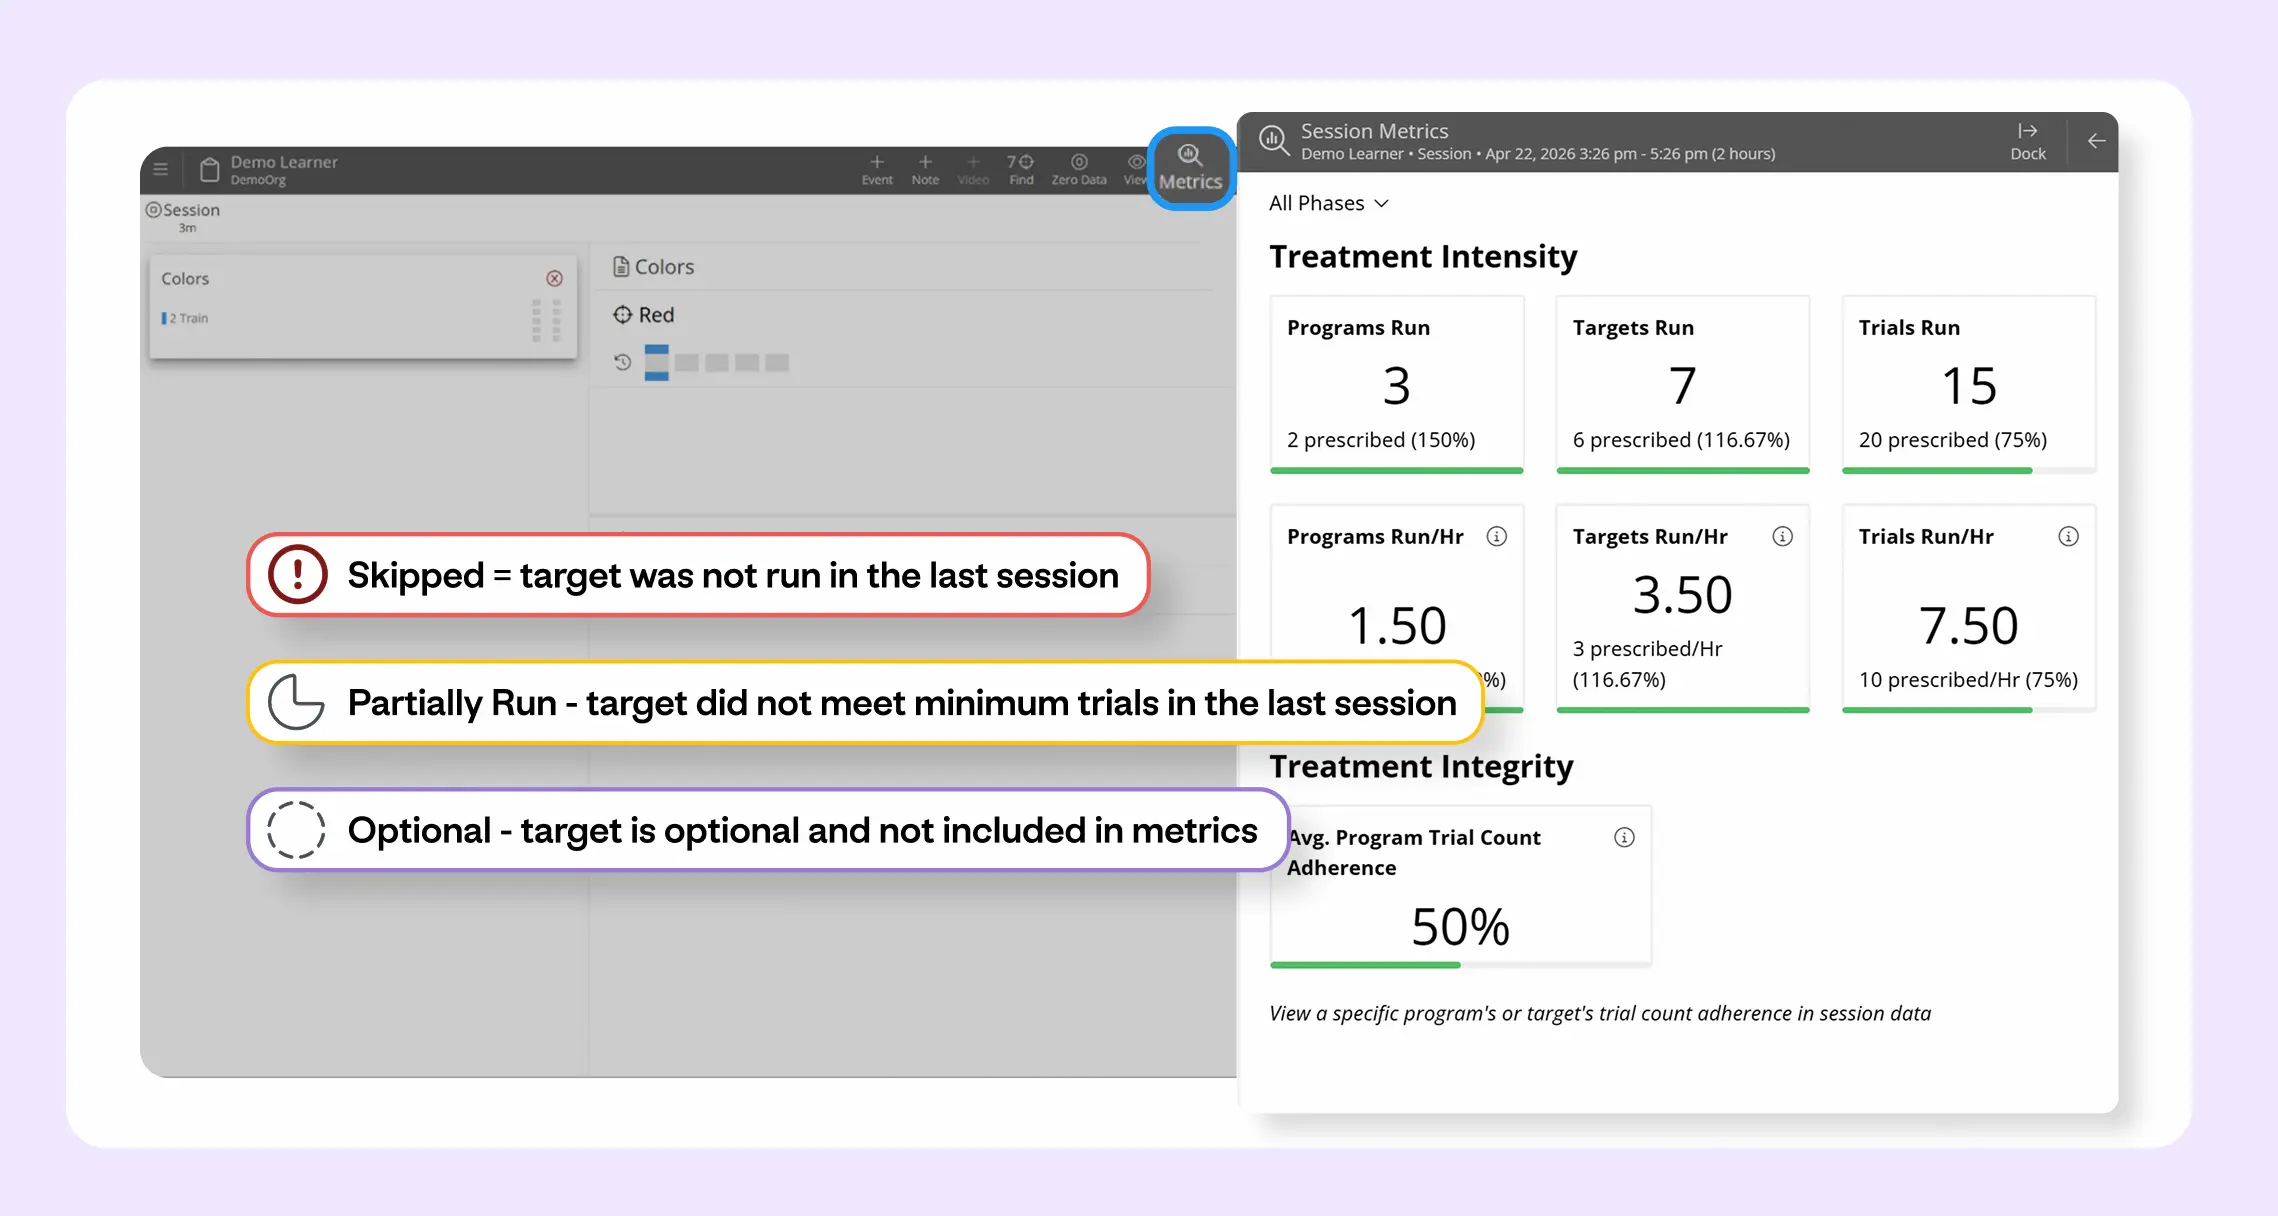
Session-level metrics change the starting point. ((I’ve written previously about what these specific session KPIs can tell BCBAs). When you can see, for each completed session, how many prescribed programs were run versus how many were expected, what percentage of trial counts were met by target and by program, and how many trials per hour the session produced, you're starting from evidence.
Some patterns that tend to surface and what they're more likely to point to:
- Trial counts met but session intensity dropping over time. It's worth checking whether interfering behaviors are eating into teaching time, or whether the prescription needs to be revisited as the learner's profile changes.
- Targets skipped repeatedly across sessions. Sometimes this reflects a program that's genuinely too low priority for the current treatment focus. Sometimes it's a workflow issue the BT hasn't flagged. The data surfaces the pattern; supervision explores the reason.
- One BT hitting high adherence while another with the same learner consistently falls short. This is where session data becomes most useful for staff development, because it's an apples-to-apples comparison. It allows us to understand what's different and whether there's something to learn from it.
Adherence data used as a compliance metric creates defensiveness. The same data used as shared clinical information opens a different kind of conversation.
Clinicians improved trial count adherence when the session view showed them what to run
The principles I've described above aren't just clinical intuition. We tested them formally. An NIH-funded study (SBIR Grant R44MH131510) examined whether adding visual cues to Motivity's session view, things like prescribed trial count displays and attention flags for skipped targets, would change how closely BTs followed what was prescribed.
After six weeks, 63% of the BTs who received the visual indicators improved their adherence by 10% or more, compared to 40% in the control group. The reason tracks with what we'd expect from behavioral science: when the environment supports accurate responding, accurate responding increases. The whitepaper covers methodology, single-subject results, and study limitations.
What Motivity built from this research
The visual indicators from the study are now live in Motivity for all users, along with a full set of session-level metrics: programs run versus prescribed, trial count adherence by target and by program, and rate metrics like trials per hour.
A BCBA reviewing a learner's timeline can spot in seconds whether last Tuesday's session fell short on dosage or whether a particular staff member is consistently underrunning certain programs.
We’ll continue to study how technology can support the clinicians who deliver care every day
That approach, designing technology around behavioral science, is how we plan to keep building at Motivity. The session-level features in this release are one piece of a broader effort. Over the coming months, we'll be working on rolling these metrics up to the learner level, then to locations, and eventually to organization-wide views.
As I said on a recent episode of the Motivators Podcast with Motivity’s founder, Rex, when BTs go into a session, they need to know how to make clinical decisions, how to prioritize their time, which goals have been neglected, and what the BCBA prescribed. That's where we started. There's a lot more to come.
If you'd like to see how these features work in your workflow, book a time with us. Our team is always happy to talk!